≡ Menu

Text Analytics and Text Mining with SAP HANA platform

Last month I finished the Open SAP Course Text Analytics with SAP HANA Platform. This was a nice opportunity to get a grip of the concepts involved. So in this blog, I give a short overview of the concepts I learned about Text Analytics and Text Mining.

Text Analytics

Text Analytics can be used to:

  • search on text related contend i.e. crm related documents
  • extract meaningful, structured information from unstructured text
  • combine unstructured data with structured data

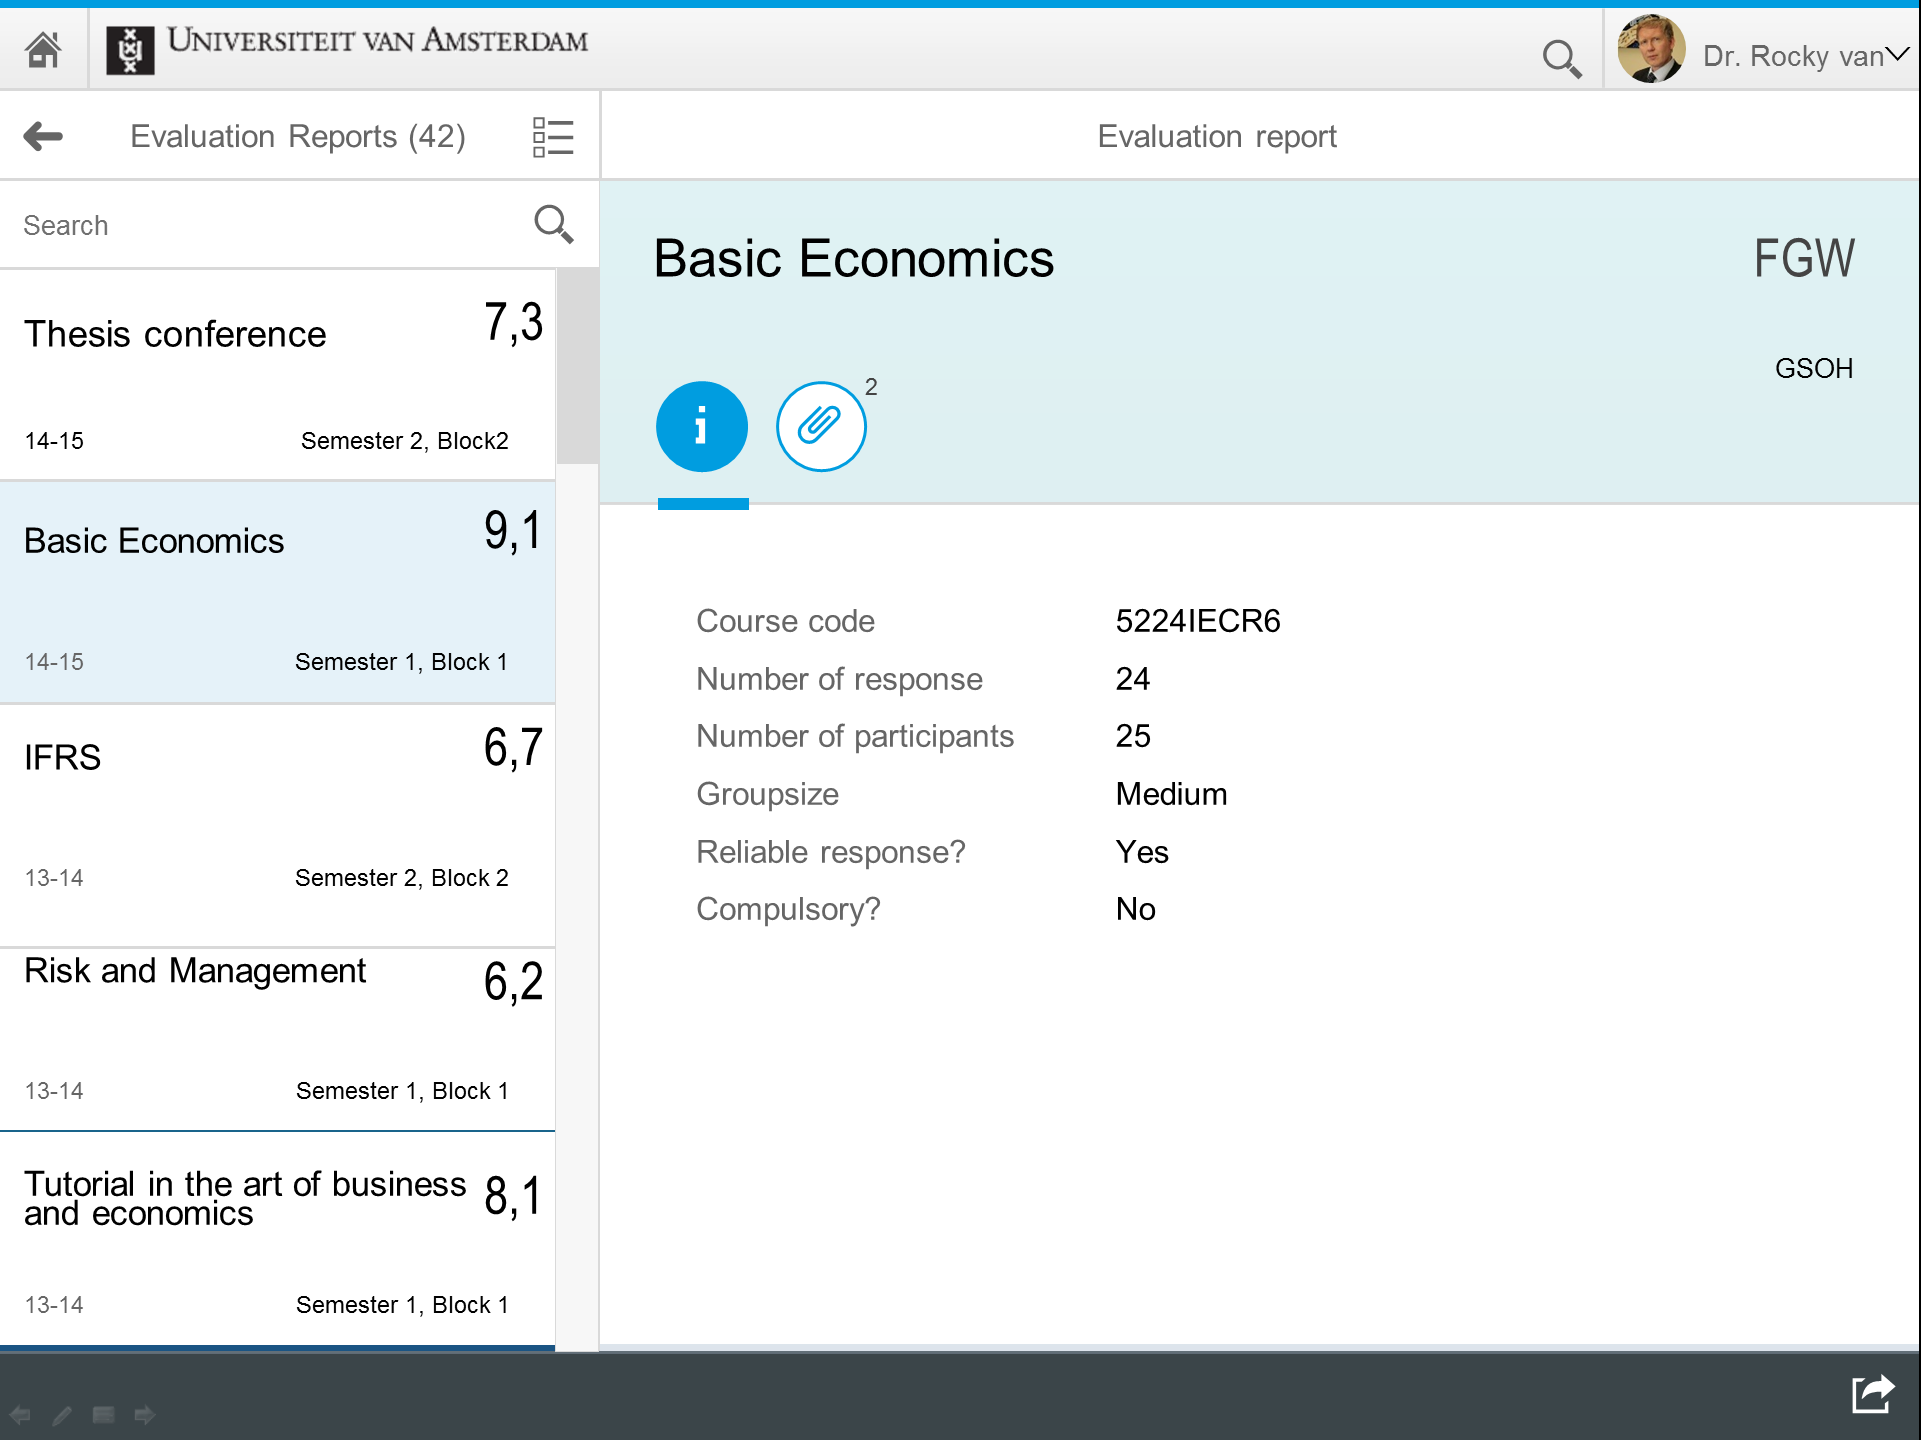
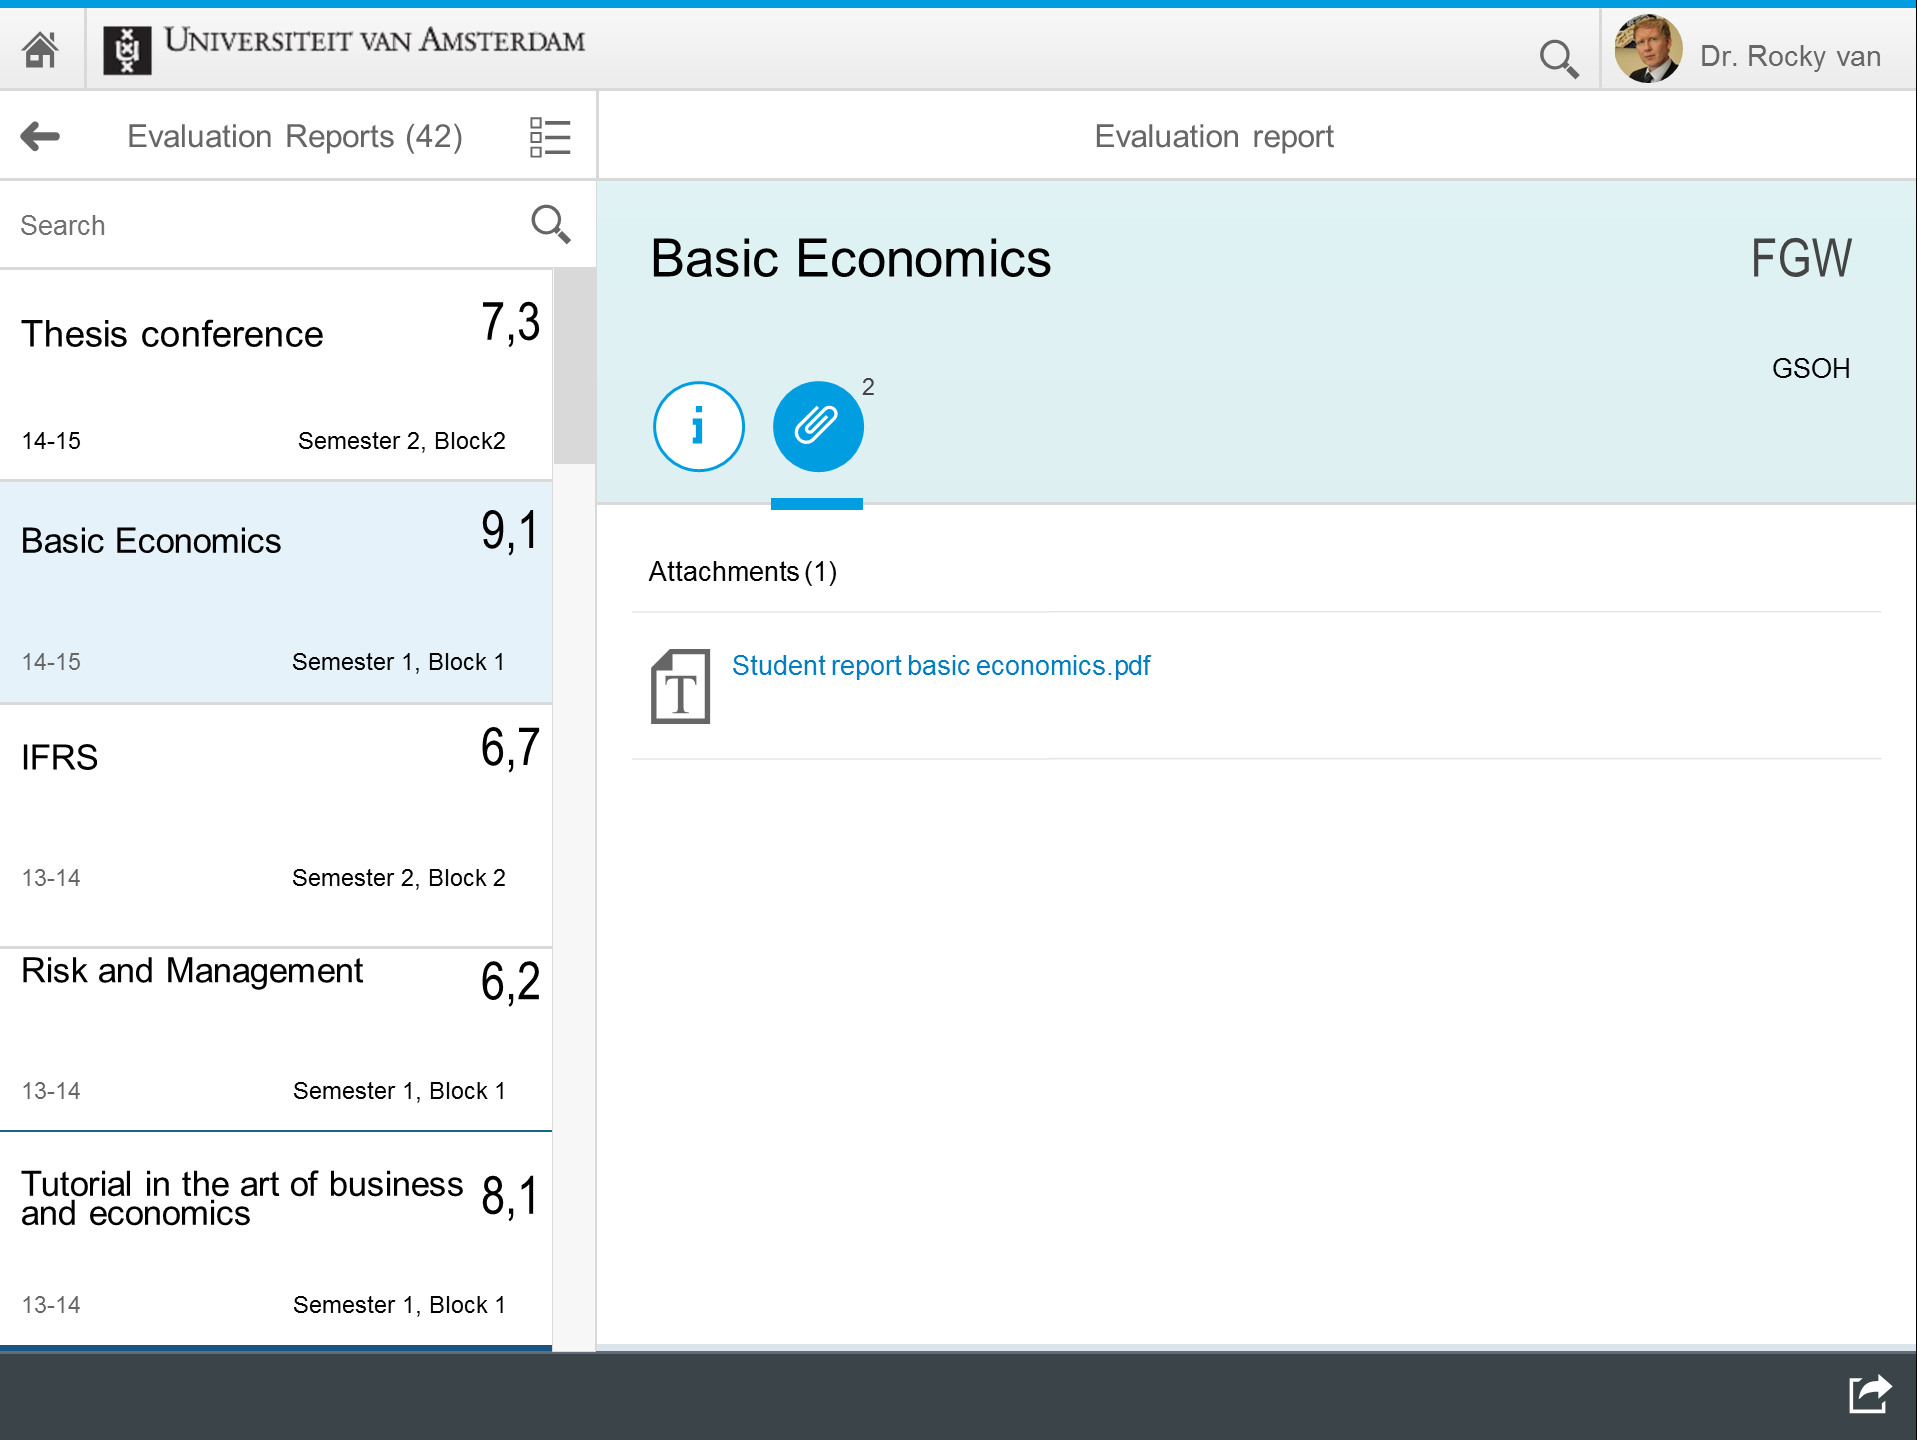
As an example, when an evaluation asks for a score and open questions, it will be useful to combine this information to see if there is a correlation.
Also, for consumer oriented companies, it can be used to structure the information on social media.

SAP HANA executes the following steps to analyze text:

1. Structuring the data
In this step all types of documents are taken apart stored in fact tables in a structured way.

  • File format filtering; convert any binary document format to text/HTML.
  • Language detection; identify the language to apply appropriate tokenization and stemming
  • Tokenization; decomposing word sequences e.g. “card-based payment systems” becomes “card” “based” “payment” “systems”
  • Stemming; normalizing tokens to linguistic base form e.g. houses -> house; ran -> run
  • Identify part-of-speech; tagging word categories, e.g. quick: Adjective; houses: Noun-Plural
  • Identify noun groups; identifying concepts e.g. text data; global piracy

2. Entity determination
In this step pre-defined entity types are used to classify the data; e.g. Winston Churchill: PERSON; U.K.: COUNTRY;
Possible entity types are:

  • Who; people, job title, and national identification numbers
  • What; companies, organizations, financial indexes, and products
  • When; dates, days, holidays, months, years, times, and time periods
  • Where; addresses, cities, states, countries, facilities, Internet addresses, and phone numbers
  • How much; currencies and units of measure
  • Generic concepts; big data, text data, global piracy, and so on

3. Fact extraction
Fact extraction is realized through rules that look for sentiments between entities.
Example: I love your product.
Love is in this context classified as a ‘Strong positive sentiment’.

Another example is known as the Voice of customer, with typical classifications:

  • Sentiments: strong positive, weak positive, neutral, weak negative, strong negative, and problems
  • Requests: general and contact info
  • Emoticons: strong positive, weak positive, weak negative, strong negative
  • Profanity: ambiguous and unambiguous

With these steps, text analysis gives ‘structure’ to two sorts of elements from unstructured text: Entities and Facts. Counting Entities and Facts can then be combined with structured information.

Text Mining

The second topic in the course is Text Mining.

Text Mining works at the document level, it is about making semantic determinations about the overall content of documents relative to other documents.
This differs from text analysis, which does linguistic analysis and extracts information embedded within documents.
With text mining you can:

  • identify similar documents;
  • identify key terms of a document;
  • identify related terms;
  • categorize new documents based on a training corpus.

The way Text Mining works is by representing a document collection as a huge terms/documents matrix. The elements of this matrix represent the weight of this term in this document.
Based on the elements of this matrix the Vector Space Module is used to calculate the similarity between documents.

To categorize documents a “reference set” of previously classified documents is used. By comparing an input document to the documents in the reference set the most likely categories are returned.

Text Mining is used for example to:

  • Highlight the key terms when viewing a patent document
  • Identify similar incidents for faster problem solving
  • Categorize new scientific papers along a hierarchy of topics

To summarize: Text Analytics and Text Mining are very interesting tools to deal with unstructured data.

SAP BO Design Studio – release 1.6 is out

In April 2015 I wrote an evaluation about the experience we had with SAP BO Design Studio 1.3, after being live for 5 months. The general feeling was that the new application was a huge substantial improvement, but we were also waiting for some enhancements to come. So now, with the new release of Design Studio 1.6 out since the end of November 2015, it is interesting to see where we stand.

Design Studio 1.4: functionality improvements – cleaner applications

With release 1.4 we have made some functional improvements to our template that will help maintain our reports and organizes them more logically.

  • Fragmented bookmarking makes the bookmarking more robust. We used to have regular bookmarking, but with that, when an application is changed, even the smallest change, all the bookmarks become invalid. With fragmented bookmarks this has been solved;
  • Context menu is used for filtering on members in the table. We used to mimic this functionality with BIAL (SAP BI Action Language) coding, but working with the context menu works a lot better;
  • In some applications we use checkbox groups, usually for key-figures;
  • Drag and drop in the filter panel is enabled;
  • Global Scripts are used to organize the BIAL coding;

Design Studio 1.5: huge performance improvement

The main thing about the 1.5 version is the improvement in performance. Initial startup became a lot faster, and also working with the tool on the platform has improvement significantly.

Further, we use the binding properties where possible to minimize the BIAL.

Design Studio 1.6: interesting improvements

I will need more time to figure out what we will be using of DS 1.6, but from reading ‘the what’s new’ document, I already like a few features:

  • Crosstabs hierarchies exported to Excel; This is something we have been waiting for. We even created an SDK component to mimic this behavior;
  • Assigning bookmarks to folders; This might be the solution for some of our users who are requesting for a central environment where they can retrieve all their bookmarks;
  • No restart after updating the SDK; A nice improvement, we always need to ask administrators to restart the servers after business hours. Not necessary anymore;

As for the new components, I need to become more familiar with them.

Platform: Netweaver versus BO BI

In March 2014, when just starting with SAP Design Studio, the Netweaver platform seemed more robust than the BO BI platform, as I described in my blog. However, since then a lot of improvements have been made to the BO BI platform. Also, SAP states that future platform development will be concentrated on the BI Platform. That makes the choosing a lot easier.

 Comparison with April this year

In April 2015 I mentioned 5 bullets we were skeptical about. My current view on them is that 4 of them are more or less covered with DS1.6, and steps are made with DS1.6 to cover the fifth:

  • Stability: with DS1.5 already the applications feel more robust;
  • Export to Excel: exporting hierarchies are now supported with DS1.6, other issues have been solved;
  • Bookmarking: with fragmented bookmarking in DS1.4, and assigning bookmarks to folders, this has improved a lot;
  • Performance: great improvement with DS1.5;
  • Mobile readiness: with DS 1.6 steps are made towards a responsive design;

To conclude: Design Studio is really getting mature. Keep up the good work!

Correlation and causation

These days I am reading the new book of Stephen Few, Signal. As always with books of Stephen Few, it sets my daily work in a new perspective and is inspiration for several ideas. One of the chapters I particularly like is about ‘correlation and causation’.

To summarize the conclusion: it is important to always use your head!

This is a conclusion I can really relate to. Nowadays with new technologies and new social media datasources there is more opportunity to find correlations between variables.

But what to do with these correlations?

Just using these correlations without knowing if there is a meaningful relation is not sound advice. As Stephen Few explains, finding a correlation between two variables is a potential step on the path of finding a cause, which can lead to something beneficial.

Also, the number of meaningful relations in the world will not increase by the number of correlations we find. It will only make them harder to find. In that sense, Big Data will give us a lot of additional correlations, but will this help in finding meaningful relations that matter?

As explained by Stephen Few, for every observed relationship between two variables X and Y, we can only conclude that X causes Y when:

  • It is certain that there is a real relationship (ruling out unreliable data measurements, statistically significant, the sample size is big enough).
  • Y does not cause X.
  • It is not the case that something else, related to X, causes Y.

Ruling out these three points is something you need your head for. And tools like SAP Design Studio and SAP Lumira can help you there with visualizations and analysis capabilities.

To conclude: always use your head!

Build Your Own SAP Fiori App in the Cloud

Yesterday I submitted my SAP Fiori UX Design and Build Challenge as part of the open sap course: Build Your Own SAP Fiori App in the Cloud. I joined the course to learn more about Fiori. In this blog I write about the experience I had and the assignment I submitted.

There are three parts to this assignment. The first is going through the Design Thinking principles. The second is a mock-up of the app to be build, and finally the (start of) a Fiori App in the cloud.

1 Design Thinking

The story

To start with the design thinking process, the story behind the app needs to be written. It should include specifics about segmentation, targeting, and positioning.

This app is about feedback tutors receive from students. Tutors give courses. Students give feedback on these courses, either digital or on paper. The feedback is scanned and stored in a dedicated system. This system generates extensive pdf reports for specific tutors.

Tutors must have easy access to the feedback concerning them, this app helps them to see the most relevant information, and have access to the generated reports

Storyline: tutors logon to a website. They get an overview of the courses they have given, with some relevant information. They can select a course and download a pdf document with all the details.

To summarize:

  • For tutors at a University
  • Easy access to pdf reports
  • Most relevant information is shown in the app the help the navigation

 A persona

The second step is about creating a persona. Personas are fictional characters based on real data to represent user types. They are extremely useful when considering goals, desires, and limitations of your app’s users and can help guide design decisions. Personas put a personal human face on otherwise abstract data you have about your users.

For the development of a persona, a template is present. This is the persona I used:

persona

An user experience journey

Finally, an User Experience Journey needs to be described where you try to visualize the journey your persona travels in using the app. The red and blue dots represent unpleasant and pleasant occurrences.

Here is journey I constructed:

journey

2 The prototype

With all this thinking done, it is time to start working on a prototype. For this a template powerpoint is available, that can be used to make a mock-up of the application. You can choose the lay-out (Master-detail in my case, I started with a smart table), icons, information, and so on.

Below is the mock-up I made.

mockup3


mockup4

3 The real app

Finally with all the thinking done, it is time to start using the SAP Web IDE. In this cloud environment you build the app. In my case, I started with a template Master-detail. Then I added some mock-up data, based on real examples. Then I tried to change the app to as designed in the mock-up. Unfortunately, I am not a skilled javascript developer, thus I didn’t get too far. But please find below some screenshots of the app, or have a look at this video: http://youtu.be/zRD5KDIMOQE. With little effort a lot already was achieved.

demo1 demo2


To conclude: I had a great learning experience in this SAP Fiori course. I like the way the Web IDE works and I the guidance that is given with all the available templates and information. The result looks great, I think a lot of SAP GUI users will be pleased with the new look&feel.

Live with SAP BO Design Studio – an evaluation

Just before Eastern we did in an evaluation on our experiences with SAP BO Design Studio, now that we have been live for 5 months. In this blog I like to share the results of our evaluation.

About the project

This project concerns an upgrade from about 100 WAD 3.5 reports. Over the years investments have been made in extending the SAP BW enterprise datawarehouse with additional datasources. Last year a front end upgrade was in order.

  • For business reasons: the reports had grown organically, an needed to be reviewed; resulting in three goals:
    • make it easier to find reports
    • make them easier to use
    • use clear report categories
  • For technical reasons: maintaining WAD3.5 reports is not supported with the latest BW releases.

The first phase of the project was designing the user interface and look and feel of the application. A graphical designer went to the drawing board and prototypes were developed in Design Studio to narrow down the requirements. This resulted in a template report with all the required functionalities in place, build with DS1.3, that was used as a base for the new reports.

Since September 2014 we are live with the new front end with most reports converted. For those that are not yet converted (sometimes due to business reasons) we point to the old WAD3.5 reports. Also, the old application is still available for users as a reference, but based on the statistics we can see the new environment is more popular.

Things we are happy about:

  • We get a lot of positive feedback from the users that it is looking beautiful and that the application is working much more intuitive than the old one.
  • From a technical perspective, the integration with the BEx queries and BW backend is very good. Hierarchies (we use a lot of those), authorization, single sign on all works very well.
  • With the BIAL, a lot of interaction is possible and easily implemented.
  • The SDK makes a lot possible and can be used to create nice things.
  • The application works in several browsers, something we didn’t have before.

Things we are not so happy about:

  • Design Studio is still growing in functionality. Compared to WAD3.5, with no developments solid as a rock, it shows sometimes unexpected behavior.
  • Export to Excel is not working as desired
    • With csv export the text gets messed up: ë becomes ë
    • With xlsx export sometimes numbers are transferred as text
    • With xlsx export the hierarchies indenting disappears (please support: https://ideas.sap.com/D15660)
    • With csv/xlsx export you only export the decimals you see on screen, whereas in WAD3.5 the decimals that were not displayed were exported as well. This can lead to the situation that after an export the elements don’t add up to the total.
  • Bookmarking is not robust enough. In the WAD 3.5 bookmarking was used extensively by our users and a feature well liked. In Design Studio a small change to a report results in losing all the bookmarks build by our users. This conflicts with our desire to be agile.
  • Performance. Compared to the WAD 3.5 reports we have lost 10 seconds on initial startup. Since we are running BW on HANA, our first suspect is the BO server, but it is very hard to figure out what is going on there.
  • Mobile readiness. The application we build is for desktop use. However, since it is a web based application, users try to view it on mobile devices and are disappointed because the sizing and scrolling is not working as expected. It would have been nice if the out of the box would support at least that.

To conclude: Doing an evaluation like this, it is always nice to see that we as a project team are often troubled with the things that are not working as desired, whereas the business sees the new application as a real substantial improvement. Also, based on previous experience, we do feel comfortable that, some way or another, solutions will appear.


Please note: this blog has also been published on SCN.